Sonification and Auditory Display Primer
An auditory display uses sound to convery information. Sonification is defined as a type auditory display that uses non-speech audio, rendering sound in response to data and interaction.
This post provides a brief introduction to sonfication based upon Chapter 2 of the Sonification Handbook.
A soundscape mapping a stock market index to ecological sounds. As the index rises, bird calls, crickets, frogs, and other forest sounds are added. As the index falls, rain and thunder are heard. The soundscape is designed to be monitoring peripherally and not to be intrusive.
Why sonification is useful
Andreas Bick's field recording of ice cracks is already in the audible range. The recording exhibits the difference between the transmission of the echoes through ice and water.
- the human auditory system is good at recognising temporal changes or patterns
- the operator may not always be able to see a visual display
- the content does not require constant observation such as warning alarms
- an existing visual system may be overloaded
- the perceiver may be visually impaired
- the data is verbal-categorical, has a high number of dimensions, or requires rapid detection
- because the rise of mobile devices mean smaller screens and less room for visual displays
Use cases
An auditory menu designed for use by drivers. You can hear the user scrolling through an address book. The spindex cues give an overview of alphabetical position, with slower navigation triggering spearcons for each contact.
- alerts and notifications (indicating an occurance)
- alarms and warnings (indicating an adverse occurance, perhaps requiring an urgent response)
- status and progress indicators
- data exploration and auditory graphs
- art, entertainment, sport and leisure
Types of Sonification
Interaction
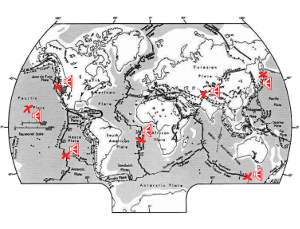 Florian Dombois' audification of Plate Tectonics demonstrates the difference between the plop of the parting Atlantic ocean plates and the crack of the plates drifting against each other).
At one end of the scale, there are non-interactive sonifications that once triggered play in their entirety as a concert or a tour around the information. This has parallels with the direction instruction method of teaching whereby an existing conclusion or viewpoint is demonstrated.
At the other end of the scale, there are user-initiated sonifications that require the user to engage in a conversation. This has parallels with the enquiry-based learning method which begins with questions, problems, or scenarios allowing knowledge to be discovered through exploration.
Somewhere in between lies the facility for manipulation of the sonification at basic level - controlling the speed, pausing, fast-forwarding, and/ or rewinding.
Methods
- Audification transforms periodic or other data that has a waveform structure into the audible range.
- Parameter Mapping Sonification extends this to other data forms, mapping a data dimension to an accoustic dimension
- Model-based Sonfication emerges from the interaction of a user with an instrument so that the data structure is understood through the sonic responses of a virtual object.
An auditory icon represents something and bears an analogous resemblence so that it should be understood without explanation. An earcon is more symbolic, and has and arbitrary mapping of sound to meaning. Although Earcons are more flexible, they may have to be learned. The spearcon, a speech earcon, has the potential to offer the best of both worlds - flexibility and understandability. A spindex is a set of brief speech sounds that are used to navigate a long menu.
Design Considerations
Qualitative data may be better represented by dimensions of sound that are perceived as categorical, such as timbre. Whereas pitch or loudness, which are more continuous, may be better for ratio or interval data.
The polarity of the mapping matters. In one study, listeners agreed that pitch should increase with increasing temperature but that it should decrease with increasing size.
While the human hearing range stretches from about 20 Hz to 20,000 Hz, it may be more successful to scale data to the range where hearing is most sensitive, for example between 1000-5000 Hz.
A musical model, for example the notes on a piano, can provide a scale with perceptually equal steps. This convenience does come at the cost of resolution. A MIDI display using only notes 35-100 provides 65 points whereas a microtonal scale would be comparatively infinite.
Monitoring tasks require that the listener has a priori knowledge of a particular template so that they may recognise a sound and it’s meaning.
Concurrent presentation of multiple data streams requires that the user be able to segregate the streams. Differences in timbre (musical instrument) or spatial separation (stereo panning) have been used for this purpose.
Context cues can aid perception. Like tick marks on the axis of a visual graph, a series of clicks can help the user keep track of time and a repeating reference tone can help with point estimation.
The Sonification of Tohoku Earthquake accelerates seismic activiy by a factor of 1440 to bring signal into the audible range.</a>